
MTTR, MTBF and OEE: The Maintenance Metrics That Hold Operations Up

Dhananjay Chandra Kulal
Author
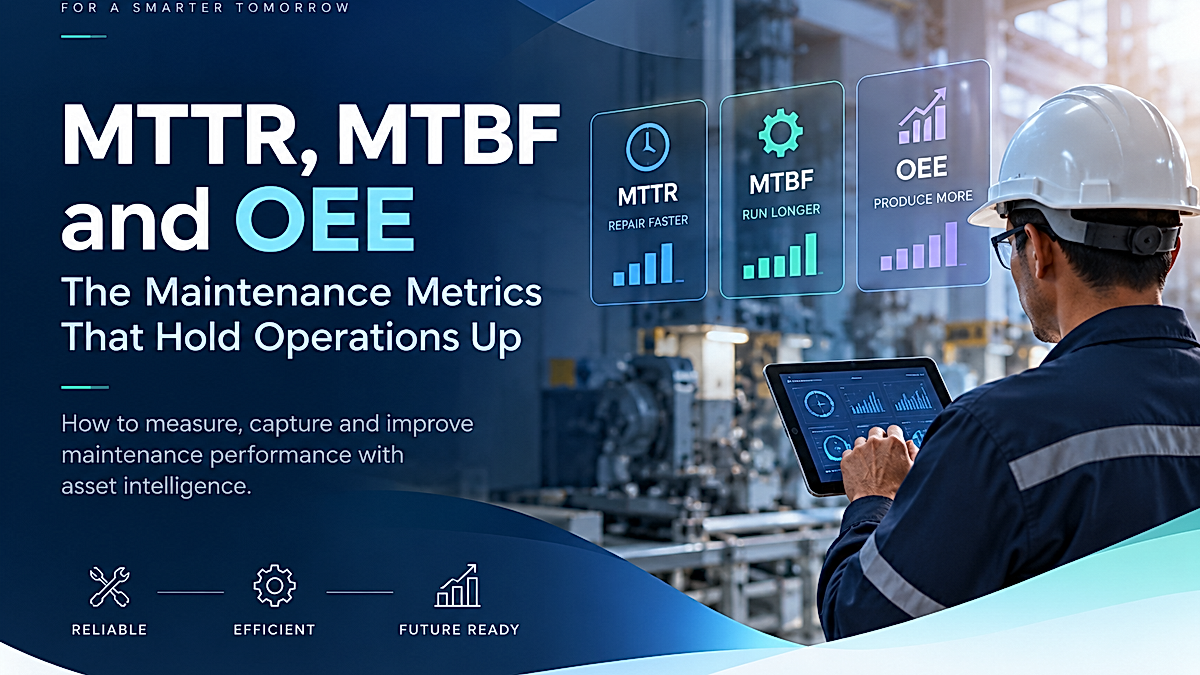
In modern industrial operations, maintenance is no longer measured only by whether a machine is running or stopped. The real question is: how reliably is the asset performing, how quickly can it be restored, and how much productive value is it delivering?
Three metrics help answer those questions better than most:
- MTTR — Mean Time to Repair
- MTBF — Mean Time Between Failures
- OEE — Overall Equipment Effectiveness
Individually, these metrics reveal different aspects of maintenance performance. Together, they provide a clearer picture of asset reliability, maintainability and operational productivity.
However, simply calculating MTTR, MTBF and OEE is not enough. Their value depends on how consistently data is captured, how accurately downtime is classified and how effectively organizations use asset intelligence to turn numbers into action.
This article explains what each metric means, how to calculate and capture it, and how asset intelligence can make maintenance measurement more accurate and useful.
Why Maintenance Metrics Matter
Maintenance teams operate in an environment where every unexpected failure can affect production schedules, labour costs, product quality and customer commitments.
Without measurable performance indicators, maintenance decisions often become reactive. Teams may know that equipment is failing frequently, but they may not know:
- Which assets are responsible for the most downtime
- How long repairs actually take
- Whether reliability is improving or declining
- Which failures occur repeatedly
- How maintenance activities affect production output
- Where improvement efforts should be focused
This is where maintenance metrics become essential.
MTTR measures maintainability. MTBF measures reliability. OEE measures how effectively equipment converts available time into productive output.
Together, they help organizations move from asking “What went wrong?” to asking “Why does this keep happening, and what should we improve?”
Understanding MTTR: Mean Time to Repair
What Is MTTR?
Mean Time to Repair (MTTR) measures the average time required to repair an asset and restore it to operational condition after a failure.
The metric typically includes activities such as:
- Diagnosing the problem
- Accessing the equipment
- Performing the repair
- Replacing damaged components
- Testing the asset
- Returning the asset to service
The basic formula is:
MTTR = Total Repair Time ÷ Number of Repairs
Example
Imagine a production machine experiences four failures in a month. The total time spent repairing the machine is 12 hours.
MTTR = 12 hours ÷ 4 repairs = 3 hours
The average repair time is therefore 3 hours.
Why MTTR Is Important
A low MTTR generally indicates that maintenance teams can restore assets quickly.
However, MTTR should never be viewed in isolation.
A fast repair may look positive on a dashboard, but repeated quick repairs could indicate that technicians are fixing symptoms rather than eliminating the root cause.
For example:
- Asset A fails once and requires six hours to repair.
- Asset B fails six times and requires one hour for each repair.
Both assets may have a similar total repair time, but the reliability challenge is very different.
That is why MTTR works best when analysed alongside MTBF and failure history.
How to Capture MTTR Accurately
The quality of MTTR depends heavily on consistent data collection.
Maintenance teams should capture:
- Failure start time
- Time the maintenance team was notified
- Time work began
- Time the repair was completed
- Time the asset returned to operation
- Failure category
- Asset involved
- Technician or team involved
- Parts used
Organizations should also clearly define what counts as repair time.
For example, does MTTR include:
- Waiting for a technician?
- Waiting for spare parts?
- Waiting for production approval?
- Diagnostic time?
- Testing and restart time?
There is no universal operational definition that fits every organization. What matters most is maintaining a consistent definition across assets and reporting periods.
Understanding MTBF: Mean Time Between Failures
What Is MTBF?
Mean Time Between Failures (MTBF) measures the average amount of operating time between equipment failures.
It is commonly used as an indicator of asset reliability.
The basic formula is:
MTBF = Total Operating Time ÷ Number of Failures
Example
A machine operates for 1,000 hours during a reporting period and experiences five failures.
MTBF = 1,000 ÷ 5 = 200 hours
On average, the machine operates for 200 hours between failures.
Why MTBF Matters
MTBF helps maintenance and reliability teams understand how frequently equipment fails.
Generally, a higher MTBF suggests that an asset can operate for longer periods without failure.
Tracking MTBF over time can help identify:
- Declining equipment reliability
- Recurring failure patterns
- The impact of maintenance strategies
- Assets that require replacement or redesign
- Opportunities for preventive maintenance
- Improvement after corrective actions
For example, if an asset's MTBF improves from 120 hours to 300 hours after changes to its maintenance program, that improvement may indicate that the intervention is working.

The Importance of Defining a “Failure”
MTBF can become misleading when organizations do not clearly define what counts as a failure.
- Should a brief sensor issue count?
- What about an operator adjustment?
- Does a planned shutdown count?
- What happens when a machine continues operating at reduced performance?
These questions matter because inconsistent failure classification can distort reliability reporting.
A strong maintenance data strategy should define:
- What constitutes an equipment failure
- Which events are excluded
- How partial failures are recorded
- How planned downtime is treated
- Which assets are included in MTBF calculations
Consistency is more valuable than simply collecting more data.
Understanding OEE: Overall Equipment Effectiveness
What Is OEE?
Overall Equipment Effectiveness (OEE) measures how effectively manufacturing equipment is used during planned production time.
OEE combines three factors:
- Availability
- Performance
- Quality
The formula is:
OEE = Availability × Performance × Quality
Availability
Availability measures how much of planned production time the equipment was actually available for operation.
Availability = Operating Time ÷ Planned Production Time
Unplanned breakdowns, equipment failures and other downtime events can reduce availability.
Performance
Performance measures whether equipment is operating at its intended or ideal production speed.
Performance = Actual Output Rate ÷ Ideal Output Rate
Performance losses can result from:
- Reduced machine speed
- Minor stops
- Equipment wear
- Process inefficiencies
- Material problems
Quality
Quality measures the proportion of good units produced.
Quality = Good Units ÷ Total Units Produced
Quality losses may result from:
- Defects
- Rework
- Startup losses
- Process instability
OEE Example
Suppose a production asset has:
- Availability: 90%
- Performance: 95%
- Quality: 98%
The calculation is:
OEE = 0.90 × 0.95 × 0.98
OEE = 83.8%
This means the equipment is effectively converting approximately 83.8% of its planned production potential into good output at the expected rate.
MTTR, MTBF and OEE: How They Work Together
Each metric answers a different question.
| Metric | What It Measures | Key Question |
| MTTR | Maintainability | How quickly can we restore the asset? |
| MTBF | Reliability | How long does the asset operate between failures? |
| OEE | Operational effectiveness | How effectively is the equipment producing? |
Together, these metrics provide a broader maintenance and operations picture.
For example:
High MTBF + Low MTTR
This is generally a strong position.
The asset fails infrequently, and when failures occur, the maintenance team restores it quickly.
Low MTBF + Low MTTR
The maintenance team may be responding efficiently, but the asset is still failing too frequently.
The focus should shift toward:
- Root cause analysis
- Reliability improvement
- Preventive maintenance
- Component redesign
- Operating condition analysis
High MTBF + High MTTR
The asset is relatively reliable, but failures take too long to resolve.
Possible issues may include:
- Lack of spare parts
- Limited technician availability
- Complex repair procedures
- Poor documentation
- Difficult asset access
Low MTBF + High MTTR
This combination can be particularly damaging. The equipment fails frequently and remains unavailable for long periods.
This often requires a more comprehensive reliability and maintenance intervention.
The Challenge of Manual Maintenance Tracking
Many organizations still track maintenance performance using spreadsheets, paper logs or disconnected systems.
While these methods can capture basic information, they often create challenges such as:
- Missing timestamps
- Inconsistent failure descriptions
- Duplicate asset names
- Incomplete work orders
- Difficulty linking failures to specific components
- Limited historical visibility
- Delayed reporting
For example, a technician may record that a machine was “repaired,” but without accurate information about:
- What failed
- Why it failed
- How long the repair took
- Which component was replaced
- Whether the same issue occurred before
the data has limited analytical value. This is where asset intelligence becomes increasingly important.

How Asset Intelligence Changes Maintenance Measurement
Asset intelligence goes beyond simply storing maintenance records.
It connects asset data from multiple sources to create a more complete understanding of equipment performance and condition.
Depending on the system and environment, asset intelligence may bring together:
- Work order history
- Asset hierarchy
- Sensor data
- Condition monitoring
- Maintenance records
- Failure codes
- Spare parts information
- Production data
- Operator observations
- Historical repair information
The result is more than a maintenance dashboard. It creates context.
Instead of simply seeing that an asset has an MTTR of four hours, teams can investigate:
- Which failure types contribute most to repair time?
- Are technicians waiting for specific spare parts?
- Does the same component repeatedly fail?
- Does repair time vary between shifts?
- Are certain operating conditions linked to failures?
That context is what turns maintenance metrics into actionable intelligence.
Improving MTTR With Better Asset Intelligence
Asset intelligence can help reduce MTTR by making the right information available when maintenance teams need it.
For example, a technician responding to a failure may be able to access:
- Previous repair procedures
- Asset manuals
- Equipment history
- Recommended spare parts
- Known failure patterns
- Digital work instructions
- Similar incidents from other assets
This reduces the time spent searching for information and diagnosing recurring problems.
Organizations can also analyse MTTR by:
- Asset
- Failure type
- Component
- Maintenance team
- Location
- Shift
- Spare part availability
This helps identify the real causes of long repair times.
Improving MTBF Through Reliability Insights
MTBF improves when organizations reduce the frequency of equipment failures. Asset intelligence supports this by helping teams identify recurring patterns.
For example, data may reveal that:
- A motor consistently fails after operating under high temperatures.
- A pump requires repeated repairs after a specific number of operating hours.
- Failures increase during a particular production cycle.
- Certain components fail more frequently than expected.
These insights can support:
- Preventive maintenance optimization
- Condition-based maintenance
- Predictive maintenance strategies
- Root cause analysis
- Asset redesign
- Better spare parts planning
The goal is not simply to repair equipment faster. The larger objective is to prevent unnecessary failures from occurring in the first place.
Using OEE to Connect Maintenance and Production
OEE is particularly valuable because it connects maintenance performance directly with production outcomes.
A maintenance issue may affect OEE through:
- Reduced availability caused by breakdowns
- Lower performance caused by equipment degradation
- Quality losses caused by asset instability
This makes OEE an important bridge between maintenance and operations.
Instead of maintenance teams focusing only on the number of completed work orders, they can understand how asset reliability affects overall production effectiveness.
For example, an asset may not experience major breakdowns, but frequent minor stops could reduce performance significantly.
MTTR and MTBF alone may not reveal the full impact. OEE helps bring those smaller losses into the operational picture.
How to Build a Maintenance Metrics Tracking System
Organizations do not need to begin with an overly complex analytics platform. A practical maintenance tracking system can start with a structured template. At a minimum, track the following information.
Asset Information
- Asset ID
- Asset name
- Location
- Asset category
- Criticality level
Failure Information
- Failure date
- Failure start time
- Failure end time
- Failure type
- Failure description
- Root cause
- Component affected
Repair Information
- Repair start time
- Repair completion time
- Total repair duration
- Technician or maintenance team
- Spare parts used
- Repair action taken
Operating Information
- Operating hours
- Planned production time
- Downtime
- Production output
- Good units
- Rejects
With this information, organizations can calculate and track MTTR, MTBF and OEE more consistently.
A Simple MTTR, MTBF and OEE Tracking Template
A basic tracking template can include the following sections:
Maintenance Events
Date—Asset—Failure Type—Downtime—Repair Time—Root Cause
Reliability Tracking
Asset—Operating Hours—Failures—MTBF
Repair Performance
Asset—Total Repair Time—Number of Repairs—MTTR
Production Effectiveness
Asset—Availability—Performance—Quality—OEE
The most important part of the template is not the spreadsheet itself. It is the discipline behind data capture.
If teams record events consistently, even a simple tracking system can reveal meaningful maintenance patterns.
Common Mistakes When Tracking Maintenance Metrics
1. Using Inconsistent Definitions
If one team records waiting time as part of MTTR while another does not, comparisons become unreliable. Create clear definitions for every metric.
2. Measuring Metrics Without Context
A lower MTTR is not always better if it results from temporary repairs that lead to repeated failures. Always investigate the broader reliability picture.
3. Ignoring Minor Stops
Small, frequent interruptions may not appear as major failures, but they can significantly affect OEE and productivity.
4. Tracking Too Many Metrics
More metrics do not automatically create better maintenance performance. Focus on the metrics that support real decisions.
5. Failing to Act on the Data
Metrics should lead to action. If data shows recurring failures, the next step should be investigation and improvement—not simply another report.
Moving From Maintenance Data to Maintenance Intelligence
The future of maintenance measurement is not simply about collecting more numbers. It is about creating connections between those numbers.
A modern maintenance approach should help organizations understand:
- What failed?
- How often does it fail?
- How long does recovery take?
- What caused the failure?
- How does the failure affect production?
- Can the failure be predicted or prevented?
MTTR, MTBF and OEE provide a strong foundation for answering these questions.
When combined with accurate asset data and intelligent analysis, they can help organizations move beyond reactive maintenance toward more reliable, efficient and informed operations.
Conclusion
MTTR, MTBF and OEE are more than standard maintenance KPIs. They represent three important dimensions of asset performance:
- MTTR shows how quickly equipment can be restored.
- MTBF shows how reliably equipment operates.
- OEE shows how effectively equipment contributes to production.
The real value comes from understanding how these metrics influence one another.
A fast repair does not solve a recurring reliability problem. High availability does not guarantee strong performance. And strong production output does not always mean underlying asset issues are being addressed.
By capturing maintenance data consistently and connecting it through asset intelligence, organizations can gain a clearer view of equipment performance—and make better decisions about reliability, maintenance strategy and operational improvement.
The goal is not simply to measure maintenance. It is to use maintenance data to build more reliable, productive and resilient operations.